
Telling Stories with Data
Welcome to my portfolio for Carnegie Mellon University’s Telling Stories with Data (94-870) course for Fall 2025. This page showcases my journey in learning to effectively communicate insights through data visualization and storytelling.
This portfolio is integrated into my personal website. To view assignments for this class, please use the “Telling Stories with Data” dropdown in the navigation bar or scroll down to the relevant project.
- Website: https://daesavellano.github.io/dandalandan-portfolio/tswd/
- Repository: https://github.com/daesavellano/dandalandan-portfolio/
Note: Some menu items are placeholders from the provided templates.
About Me
I’m Danielle Aira Savellano (or Dana or Dan), a graduate student pursuing my M.S. in Health Care Analytics and Information Technology at Carnegie Mellon University’s Heinz College. With a background in Biology, Computer Science, and Global Health Studies from Allegheny College, I’m passionate about bridging the gap between healthcare and technology through evidence-based, community-focused solutions.
One thing not a lot of people know about me is that I went to a science high school! Throughout that time, I was very interested in art and design. It’s no wonder that I now have a mission to translate complex data into actionable (and beautiful) insights that address real-world challenges. Through this class, I hope to develop the skills necessary to tell compelling stories with data that can drive meaningful change in healthcare and public policy.
What I Hope to Learn
Through the Telling Stories with Data course, I aim to:
- Master data visualization principles. Learn how to create clear, compelling, and accurate visualizations that effectively communicate insights
- Develop storytelling skills. Understand how to structure narratives around data to engage audiences and drive action, similar to the 1 pixel wealth example
- Build on my Tableau skills. Improve my dashboarding and visualization skills, especially after having my past two summer internships working on Tableau
- Build a professional portfolio. Create a collection of data stories and finally finish (a draft of) my portfolio so that I can demonstrate my capabilities to potential employers and collaborators!
My career goal is to use data to inform and improve health policy. I am flexible in my function, with interests in roles like data analysis, policy research, and program management. My scope of interest is broad, spanning both the healthcare delivery system and the wider public health landscape, as I believe factors like community violence, education, and housing are critical determinants of health.
Portfolio
Self-Introduction Visualization
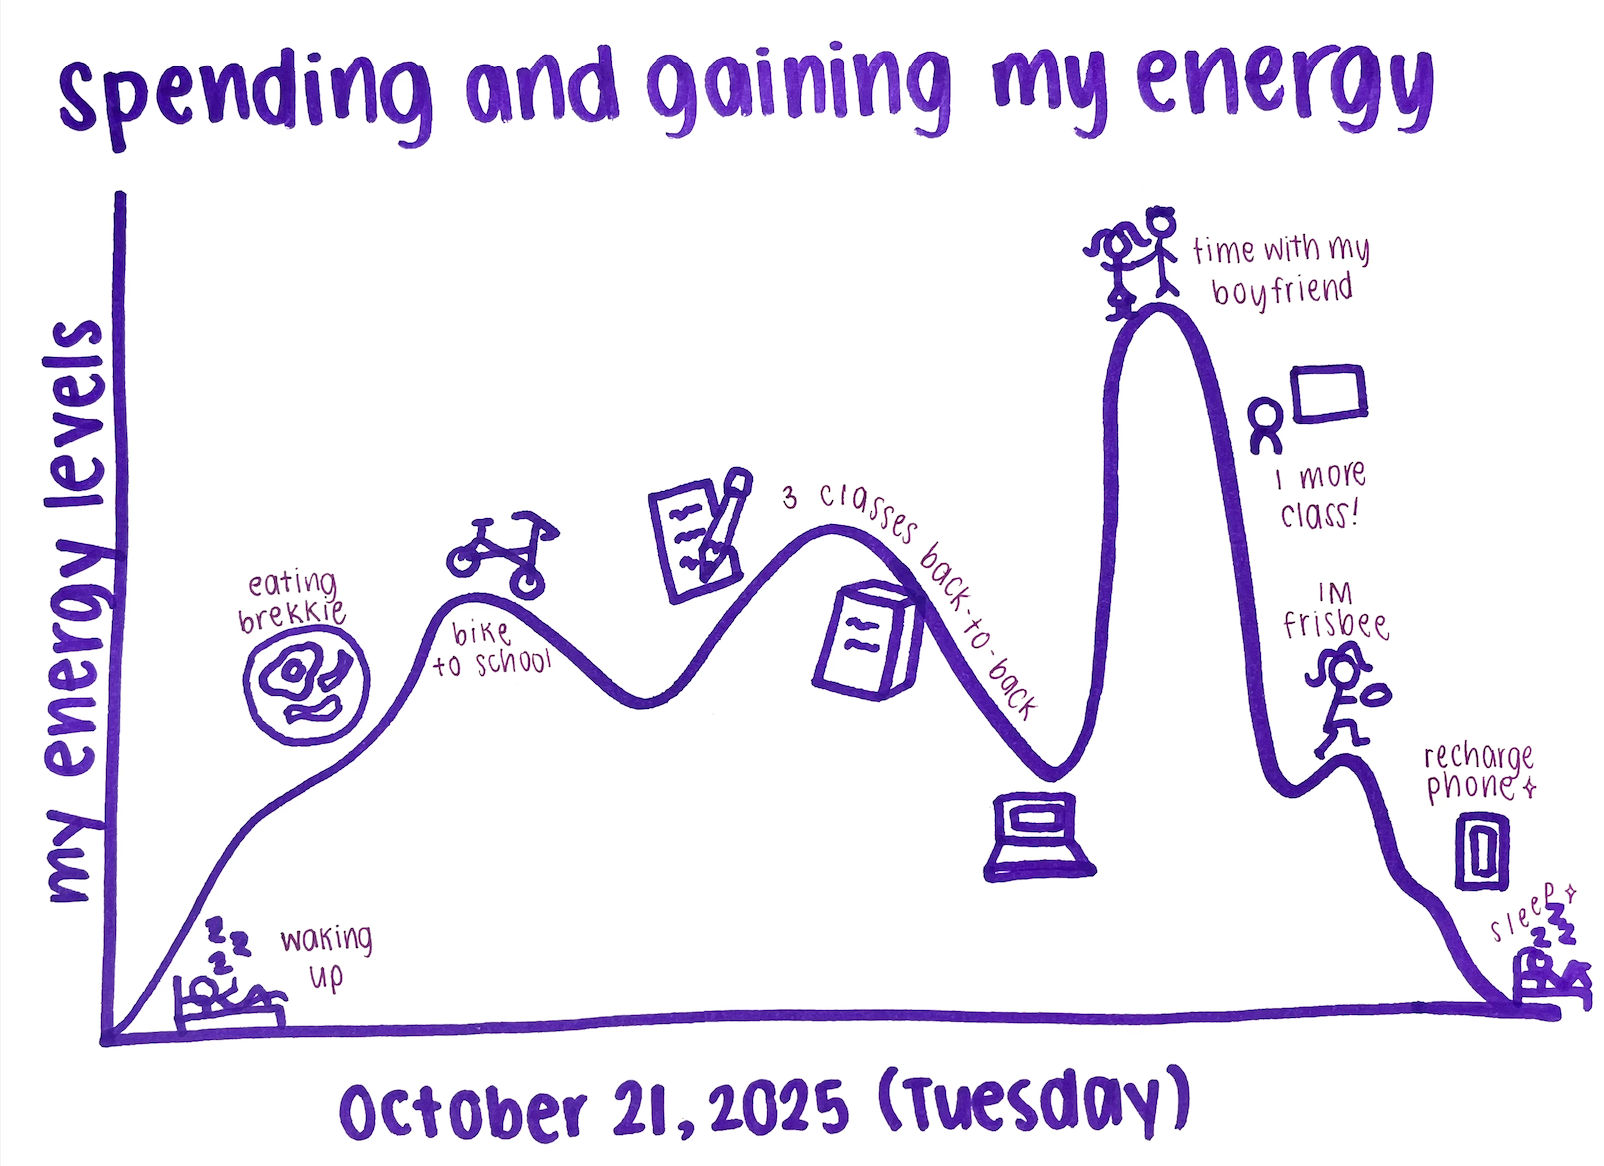
For my introductory sketch, I captured the flow of my personal energy levels throughout the day. The x-axis tracks the day’s events (not to scale) and the y-axis represents my energy. I went to sleep past midnight, so my energy levels started at zero. My energy rises after waking up and breakfast, but then drains from my bike commute and three back-to-back classes (despite a small spike from enjoying my classes). The graph’s biggest spike is from spending time with my boyfriend, which I captured as the main energy-gaining activity of the day (note: it is definitely exaggerated). After that, another class, intramural frisbee, and doomscrolling on Instagram Reels drains my energy until I crash on my bed.
Sample Data Visualizations
Coming soon
Critique Assignments
Coming soon
Final Project
Coming soon
This portfolio will be updated throughout the semester as I complete assignments and develop new skills in data storytelling.